[Skip to main text]
| HOME | SITE MAP | GLOSSARY | CONTACT CRRA | SITE SEARCH |  
Connecticut Resources Recovery Authority
EMISSIONS PERFORMANCE
WALLINGFORD PROJECT EMISSIONS PERFORMANCE

On This Page:

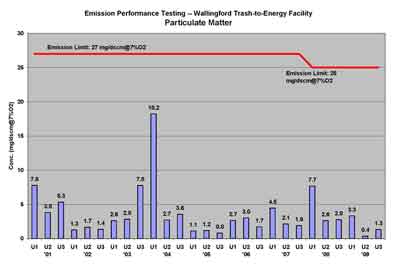
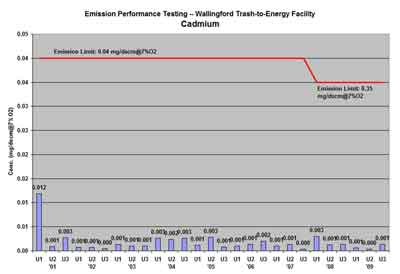
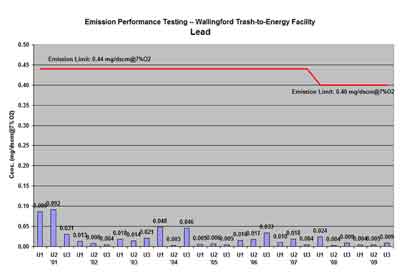
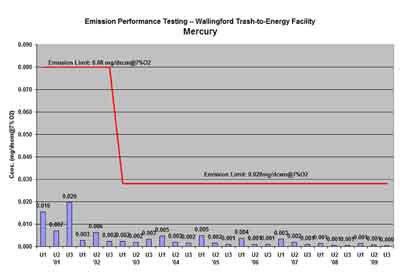
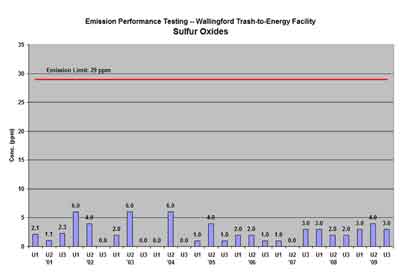
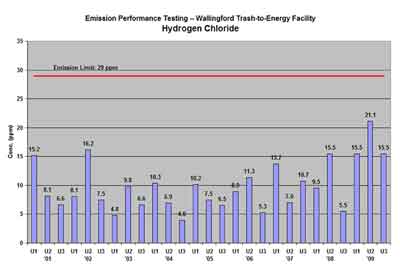
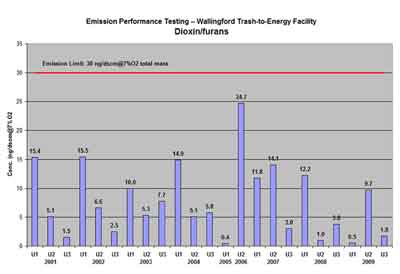
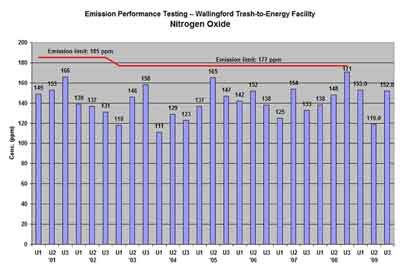
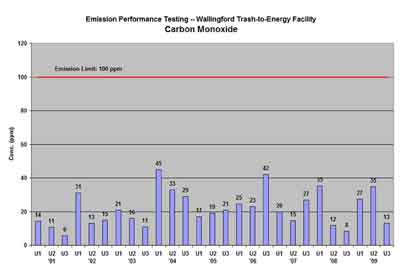
In each graph, the horizontal red line represents the emissions limit set by the U.S. Environmental Protection Agency. This emissions limit is based on the strictest criteria, which is the Maximum Available Control Technology (MACT) emissions standard.

To view enlargements of these nine graphs, click Enlarged View of Wallingford Project Emissions Testing Performance.


PARTICULATE MATTER (Emissions Testing Performance at Wallingford Project Trash-to-Energy Facility)

to top

CADMIUM

(Emissions Testing Performance at Wallingford Project Trash-to-Energy Facility)

to top

LEAD (Emissions Testing Performance at Wallingford Project Trash-to-Energy Facility)

to top

MERCURY (Emissions Testing Performance at Wallingford Project Trash-to-Energy Facility)

to top

SULFUR OXIDES (Emissions Testing Performance at Wallingford Project Trash-to-Energy Facility)

to top

HYDROGEN CHLORIDE (Emissions Testing Performance at Wallingford Project Trash-to-Energy Facility)

to top

DIOXIN/FURANS (Emissions Testing Performance at Wallingford Project Trash-to-Energy Facility)

to top

NITROGEN OXIDES (Emissions Testing Performance at Wallingford Project Trash-to-Energy Facility)

to top

CARBON MONOXIDE (Emissions Testing Performance at Wallingford Project Trash-to-Energy Facility)

to top


This CRRA.ORG page was last updated on March 10, 2006.
Copyright © 2004-2006 CRRA. All rights reserved. Credits