|
EMISSIONS PERFORMANCE
WALLINGFORD TRASH-TO-ENERGY FACILITY / ENLARGED VIEW OF EMISSIONS PERFORMANCE TEST RESULTS
On This Page:
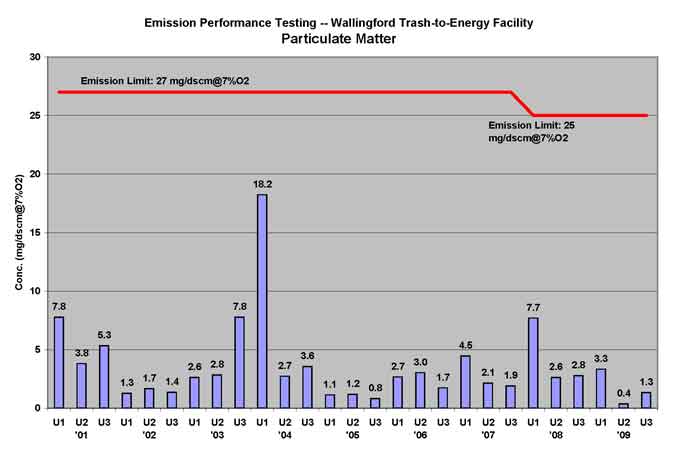
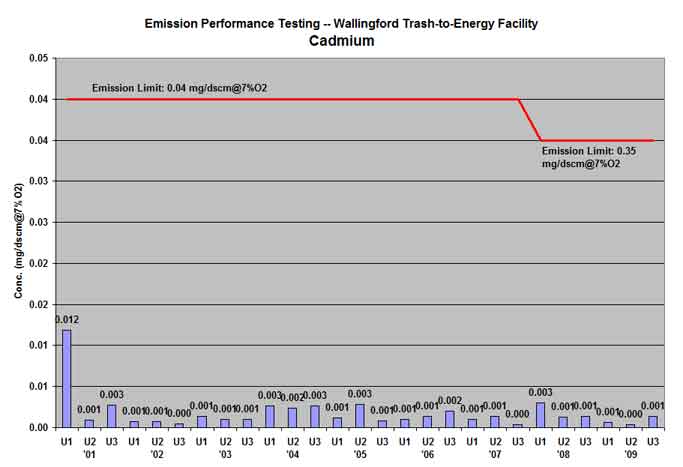
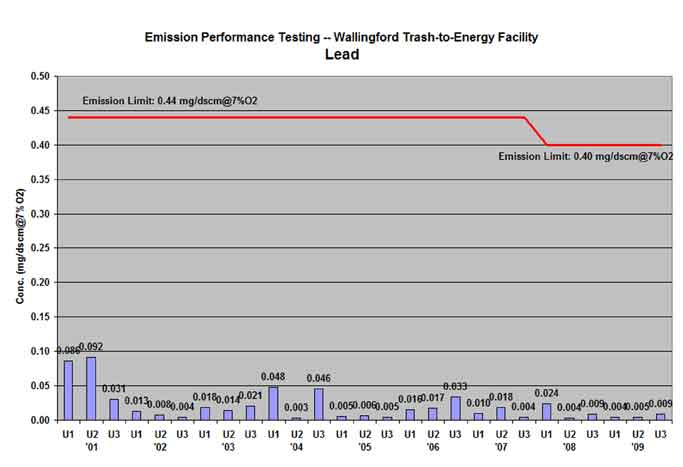
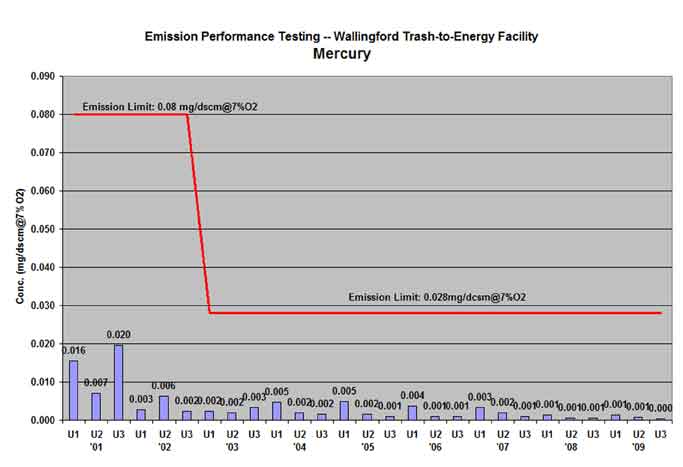
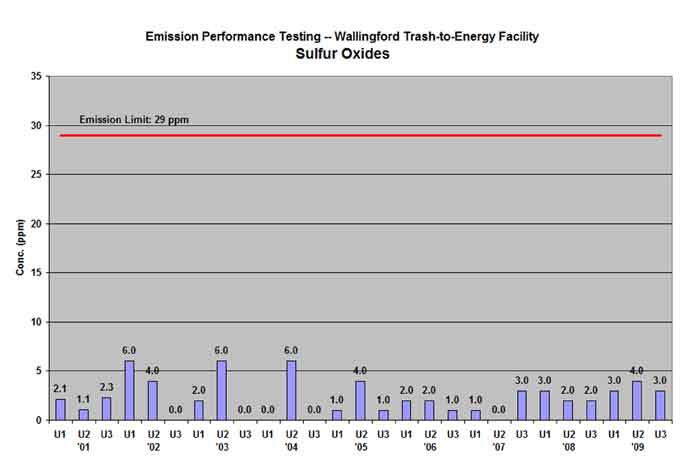
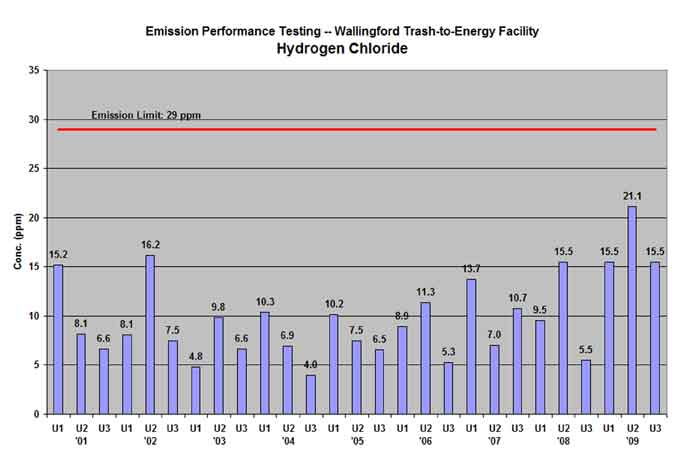
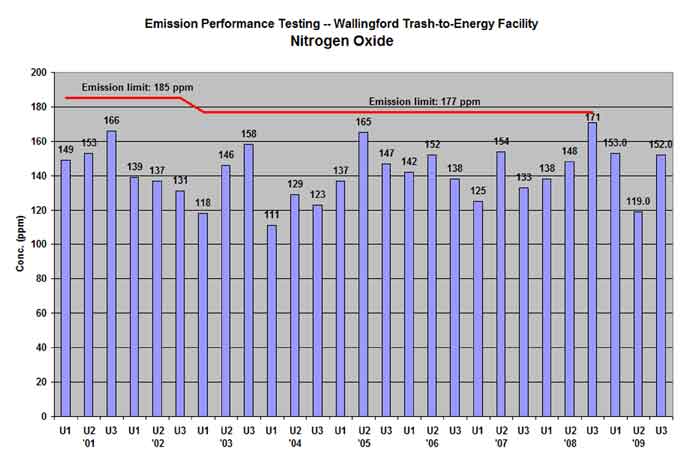
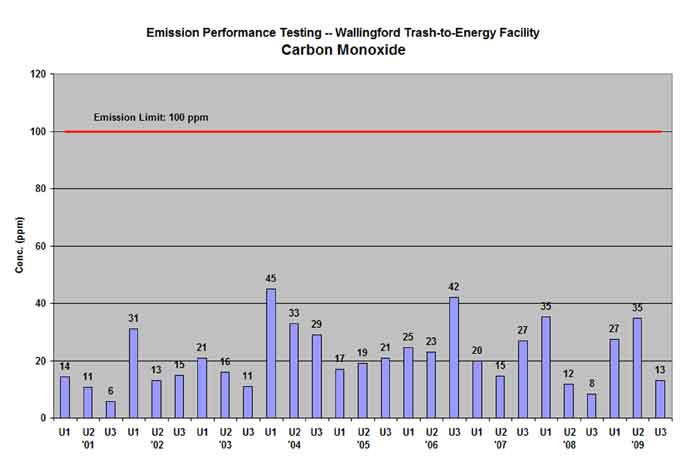
In each graph, the horizontal red line represents the emissions limit set by the U.S. Environmental Protection Agency. This emissions limit is based on the strictest criteria, which is the Maximum Available Control Technology (MACT) emissions standard.
PARTICULATE MATTER (Emissions Testing Performance at Wallingford Trash-to-Energy Facility)

CADMIUM (Emissions Testing Performance at Wallingford Trash-to-Energy Facility)
LEAD (Emissions Testing Performance at Wallingford Trash-to-Energy Facility)
MERCURY (Emissions Testing Performance at Wallingford Trash-to-Energy Facility)
SULFUR OXIDES (Emissions Testing Performance at Wallingford Trash-to-Energy Facility)
HYDROGEN CHLORIDE (Emissions Testing Performance at Wallingford Trash-to-Energy Facility)
DIOXIN/FURANS (Emissions Testing Performance at Wallingford Trash-to-Energy Facility)
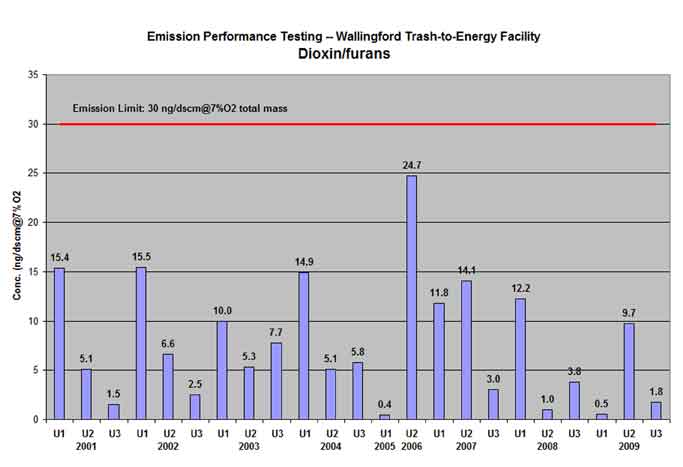
Click here to get a fact sheet about dioxin.
NITROGEN OXIDES (Emissions Testing Performance at Wallingford Trash-to-Energy Facility)
CARBON MONOXIDE (Emissions Testing Performance at Wallingford Trash-to-Energy Facility)
|